
Simulator Description
Monte Carlo Simulation
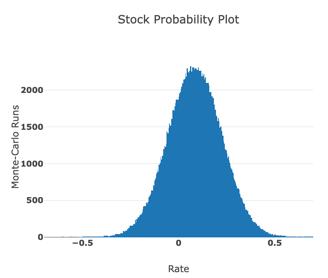
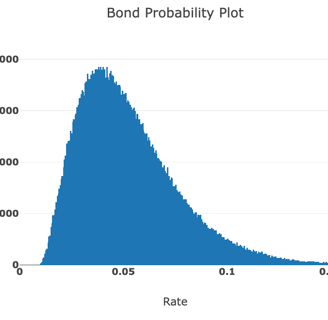
Unlike calculators that take single input details to compute how your investments will fare over time, a Monte Carlo simulator runs thousands of scenarios based on historical distributions for S&P 500, Treasury Bonds and Inflation. The input to this Monte Carlo simulator uses published data from the S&P 500 return for the past 100 years. Over this period, mean return is 11% and std. dev, or volatility is 18% as shown in the plot below. Much of the more extreme volatility comes around the WWII years which I hope we don't see repeated. If you talk to any financial advisor, and I have talked to many, none of them talk about a 11% return, and most I have talked to advise a value of around 6-8%. Probably this is to be very conservative, but also to account for commissions that are taken out from 401k's or other managed funds which can be significant. The default median return used by the my-fire simulator is a conservative 8.5% which also assumes some commission to your investments. A random normal distribution is assumed which looks reasonable from the data. For standard deviation, or volatility, I have assumed 14% as the default which is more representative of more recent years. One feature built into the my-fire simulator is both of these values can be changed as input to the simulator and the new probability distribution is calculated and displayed. There is then no ambiguity in the data that is used and you can then take a higher or lower risk approach if you choose.
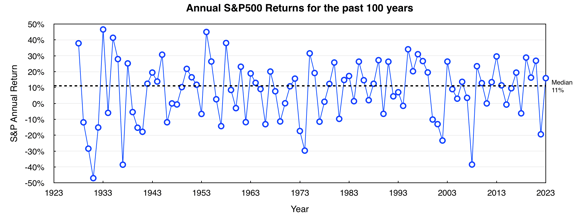

S&P500 Med = 11%
St.Dev = 18%
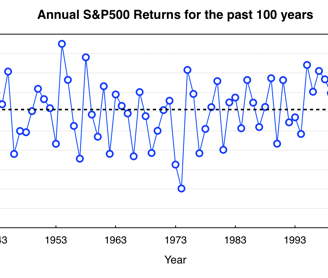
Historical data
Historical data
Input to my-fire simulator
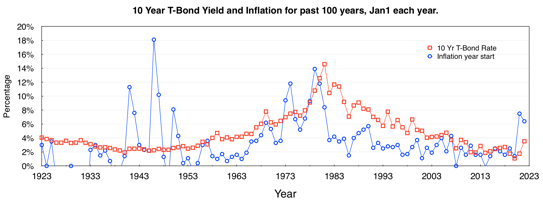
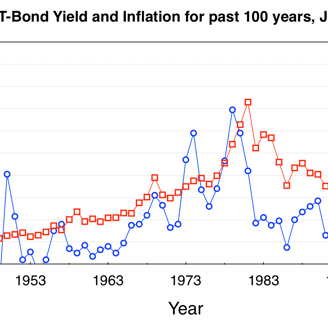
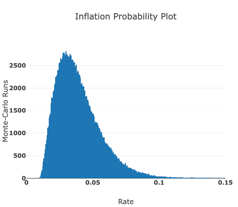
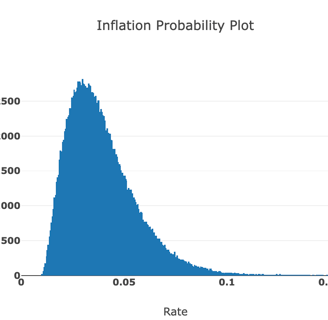
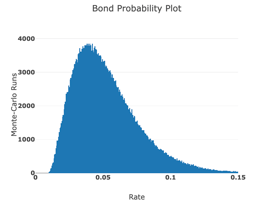
Historically, 10- year Treasury Bond and Inflation follow more of a trend rather than being a random dataset. Even so, it's hard to predict the path of the trend from year to year. Further, the distribution data is more of a skew to the high-side, with more likely outcomes being on the low-side. I'm not exactly sure what approach other Monte Carlo simulators take as this information is not readily available, but I sill see some analysis that make some reference to mean and standard deviation which doesn't seem like a great approach. I have also read many reports that inflation is now in a more stable regime with modern fiscal practices keeping inflation around 2-3% with very low volatility. Clearly more recent data for 2022/2023 that we are still living through shows that we can't preclude more severe excursions in the 8-9% range. For this reason, a different approach is used by the my-fire simulator fitting a more skew shape for the distribution. A default for mean, or really modal value is chosen to be 3% in-line with most other reports and targets for the economy. The distribution shown still allows inflation in the 8-9% range as a lower probability event, and this will for sure show up in some of the Monte Carlo runs. For bond yield, this is set at a conservative 3.8% following more recent data, but with the expectation that it should on average beat inflation. In the chart below, historically bond yield has consistently beaten inflation, but over the past 20 years by a smaller margin than historically. The skew distributions used by the my-fire simulator as shown following the historical data. Again, median values for inflation and Bond rates can be changed as inputs to the simulator.
Bond Med =4.7%
Inflation Med = 2.9%
Historical data
Input to my-fire simulator
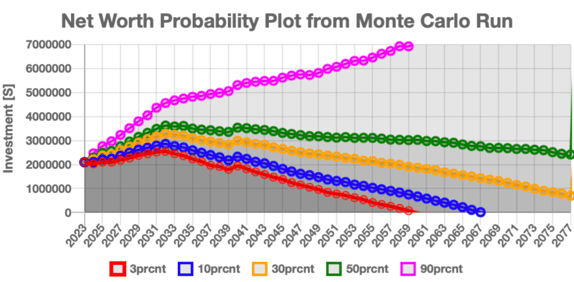
One of the simulation outputs is a probability plot showing the likelihood that your investments will last the course. All values are in todays dollars taking into account year on year inflation from the Monte Carlo runs. In the example shown, the bottom 3% poorest performing runs don't make it past 2059, and the 10% poorest runs only get to 2067. Just fewer that 30% of the poorest runs make it to 2077 which is the chosen simulation endpoint. Half of the time, the net worth is >$2m. The best 10% shown by the magenta line is way up over $7m. As you can see there is an enormous range of outcomes as a result of the spread in the stock, bond and inflation distributions. The aim is to make sure that even in the worst case scenarios you don't run out of money.
Need more advice ?
Simulations are just another tool to help with retirement planning. Speak with your financial advisor before making major financial decisions